11:00
Google introduces video selfie verification for account recovery

09:00
More details emerge on Apple's upcoming device subscription program

12:00
Major publishers consider blocking Googlebot as AI search slashes traffic

08:30
Apple plans to refresh its entire Mac lineup with around 11 new models

21:00
Samsung reveals smart glasses powered by Gemini

15:00
France bans social media for children under 15
11:00
Google introduces video selfie verification for account recovery
09:00
More details emerge on Apple's upcoming device subscription program
12:00
Major publishers consider blocking Googlebot as AI search slashes traffic
08:30
Apple plans to refresh its entire Mac lineup with around 11 new models
21:00
Samsung reveals smart glasses powered by Gemini
15:00
France bans social media for children under 15

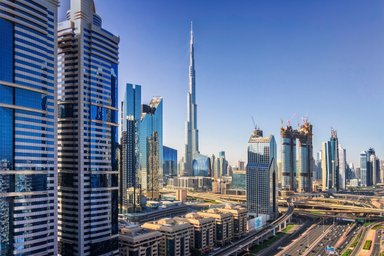
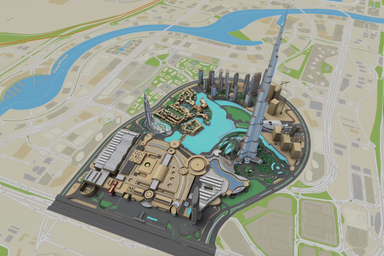
Google Earth's Timelapse feature offers fascinating glimpse into planetary changes over 38 years
It has been updated with new imagery, allowing users to visualize changes in the Earth's surface from 1984 to present day.
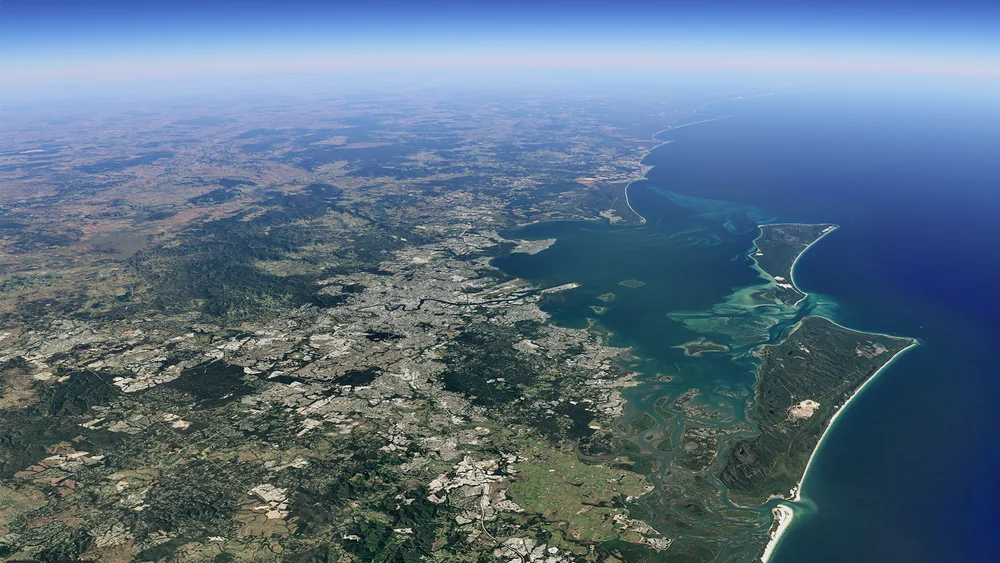
The feature, made from millions of satellite photos, provides a zoomable, 4D interactive map that displays the dynamic changes that have occurred on our planet over nearly four decades.
The Timelapse imagery reveals everything from irrigation systems emerging in the deserts of Egypt to meandering rivers shifting over time in the Amazon rainforest. It also shows how cities are adapting to combat climate change with offshore wind farms in Denmark and large-scale solar installations in Spain.
The feature is a valuable resource for researchers, educators, and anyone interested in gaining a better understanding of our planet's changing environment. Users can also access a library of over 800 Timelapse videos for more than 300 locations at g.co/TimelapseVideos. The data for Timelapse is sourced from open and accessible data through NASA's Landsat program and the European Union's Copernicus program.


Editor’s pick